In this toolkit:

Read this first
Ahead of the 2024 election, The Marshall Project surveyed incarcerated people to shed light on their political leanings. We heard from more than 54,000 people in 785 prisons and jails in 45 states and the District of Columbia.
Despite commonly held notions that people behind bars would support Democrats, the survey makes clear incarcerated people represent a wide spectrum of political opinions. For example, among White respondents, who make up roughly 30% of people held in state prison systems, support for Trump remains strong since we started conducting this survey in 2020.
Here’s why that really matters at the local level. Roughly 2 million people with felony convictions have regained the right to vote since the late 1990s, according to an analysis by The Sentencing Project. This means more people with felony convictions than ever before are legally eligible to vote for the president of the United States as well as the state-level and local officials who oversee the criminal justice system, including sheriffs, district attorneys and judges.
These restoration efforts — legislative changes, ballot initiatives and executive actions in 26 states and the District of Columbia — were largely bipartisan. Yet Republican elected officials in several states are clamping down on voting rights of people convicted of felonies.
The Marshall Project’s 2024 Election Survey makes clear that efforts to limit voting rights for the formerly incarcerated shut out potential voters across the political spectrum. And while many more people with felony convictions are eligible to vote, few do, because of numerous obstacles. As a result, people with felony records are under-engaged as potential voters. But their votes are up for grabs if either party can figure out how to appeal to them.
In this toolkit, you’ll find step-by-step instructions on how to download, analyze and report on the findings in your state both before and after the election.
National findings
Here are the key national findings from our 2024 election survey, which you can compare with the responses in your state:
- Roughly half of respondents said they would vote for former President Donald Trump.
- Support for Trump among White incarcerated people in particular has remained strong since 2020, with 61% saying they would vote for him in 2024 after Vice President Kamala Harris became the Democratic candidate (and 62% before).
- Support for Harris behind bars is significantly higher than it was for President Joe Biden before he exited the race. Seventeen percent of respondents said they would vote for Biden compared with the 33% who said they would vote for Harris when we conducted a second survey.
- Of the more than 54,000 survey respondents, 35% said they identify as independents. By contrast, half of the incarcerated independents said they lean toward neither party. The rest are roughly equally divided among Republicans and Democrats, 18%.
A unique survey
This is a landmark study of the politics of people behind bars that The Marshall Project first conducted in 2020.
We conducted the surveys via two tablet providers. Survey takers were offered small incentives (game and media credits) to complete the surveys. We designed some of our questions to mirror surveys of people outside of prison. In other cases, we specifically wrote questions to find out how imprisonment shapes political views. And we wrote a range of demographic questions so we could identify differences between groups.
This year’s survey was first conducted while Biden was the Democratic presidential nominee. We then released an updated survey once Harris entered the race.
Our survey is intended to be a snapshot of politics behind bars, but it has limitations. A larger percentage of respondents were White compared to the overall prison population. Black people are incarcerated in state prisons at five times the rate of White people, according to an analysis of state prison populations by The Sentencing Project. In 12 states, more than half the prison population is Black, the analysts found.
As a result, the survey is not representative of the overall prison population. So instead of focusing solely on the respondents as a whole, we looked for trends across race, gender, party affiliation and other demographic categories to ensure that our reported results were meaningful. We also surfaced as many individual voices and opinions as possible.
In future iterations we hope to be able to provide a more representative view. A researcher at Columbia University is currently developing “weighted” results in collaboration with the Survey Research Center at the University of Michigan to make the survey representative of the demographics, types of facility in which people are incarcerated, and geography of the jail and prison population.
How to report on survey results
Download and analyze the data
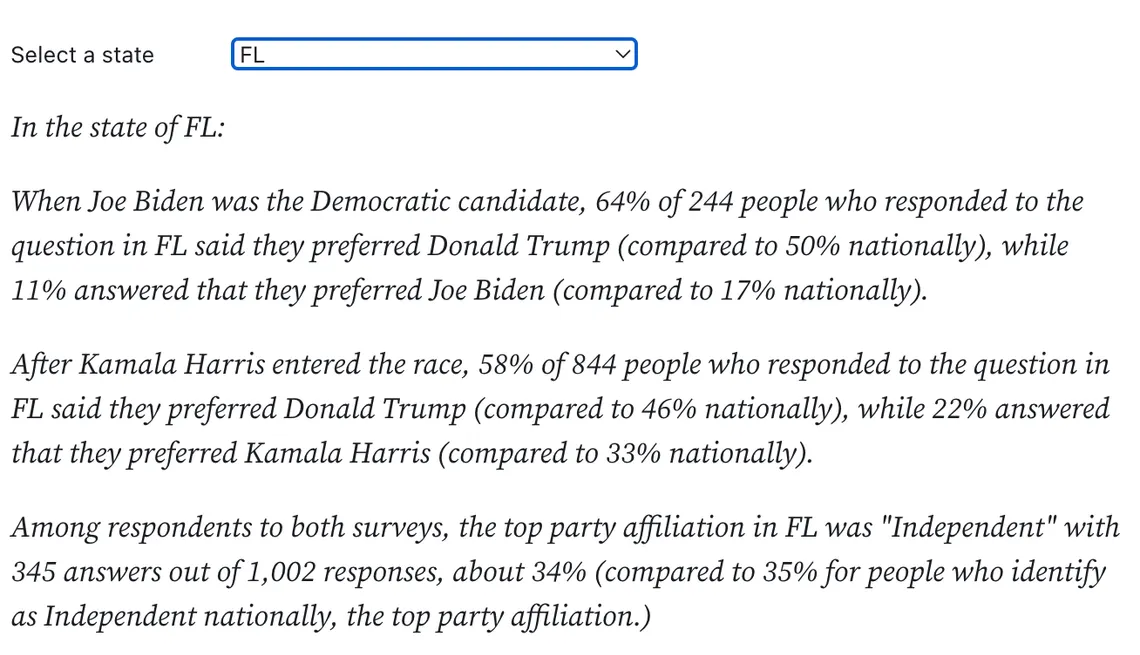
Review our public data notebook in Observable to view and download state-level data from the survey. Pick your state to get useful results to use in your storytelling and reporting, including some basic language as seen in this example:
More details are included in tables with the results for each question in our release. For example, to find information about the race of incarcerated respondents in Washington state, select “WA” in the notebook and then download the data or use the results.
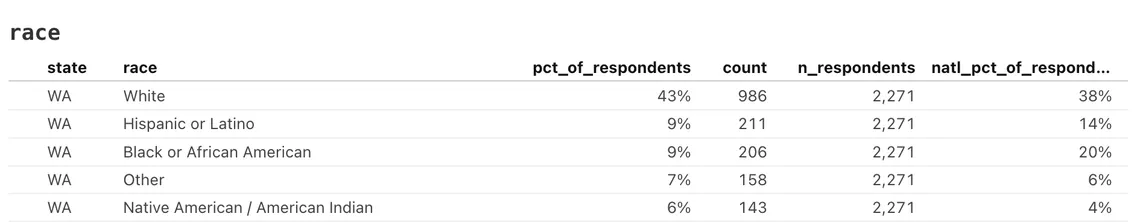
In this case, 986 of 2,271 people in Washington state (about 43%) said they were “White” alone in response to the “race” question in the survey.
Counts and percentages of the answers to selected questions for all states with responses are available as CSV downloads. National statistics are included in the same file for convenience.
As you review the state-level data, look out for how incarcerated respondents in your state compare to national responses on which candidate they would vote for, which political party they identify with, and other data points of interest for your audience. Try comparing to neighboring states, as well.
Our public data release breaks down some of the most relevant combinations of data related to political opinions and demographic factors such as race, age and gender. If you don’t see what you’re looking for in the data, or have any questions relating to our findings, just email us at investigatethis@themarshallproject.org to request additional data points for a future release.
If you use our data, please review our terms of use for Investigate This!, which includes examples of how to cite The Marshall Project anywhere in your story.
Use voices from the survey for your story
Email us at investigatethis@themarshallproject.org if you would like an exclusive list of anonymous quotes from incarcerated people who took the survey. We can offer quotes from respondents in most states. Here are a few example quotes:
“How can I expect to be taken seriously by my government/society when there’s such a strong expectation for Trump to be discarded for being a felon? Kinda makes me sympathetic to Trump.” — White Trump supporter incarcerated in Arizona.
“I think that the Democratic Party’s ‘defeat Trump at all costs’ strategy is leading the country into further discord. Instead of trying to find the best possible candidate, they are pinning all of their hopes on a woman that they have disparaged and ignored for the past 4 years.” — Black man incarcerated in North Carolina who would vote for a third-party presidential candidate.
“I think body cams and other video footage in recent years have caused the average person to have a different perspective of law enforcement than they did post 9/11. There’s much more sympathy for justice-impacted persons, particularly for offenses considered trivial or political. Don’t get me wrong, Trump is definitely a criminal mastermind who hides behind influential contacts.” — Latino undecided voter incarcerated in California.
Use this free illustration
You are welcome to publish the provided illustration within any stories derived from the materials in this toolkit, along with any related social media and newsletter promotion of those stories. Diana Ejaita must be credited in all uses. The illustration should not be published in unrelated stories. The illustration should not be cropped or altered in any way. Please reach out with any questions.
Schedule an interview
You are welcome to interview our Engagement Editor Nicole Lewis, who has covered felony disenfranchisement for The Marshall Project and has been conducting the survey since its inception in 2020. Reach out and we’ll schedule an interview with her in any format.
The following experts have provided critical insights for The Marshall Project’s voting rights reporting over the years. We’ve indicated each expert’s area of expertise below.
-
Vesla Weaver, Johns Hopkins University, Bloomberg distinguished professor of political science and sociology: Weaver is the author of “Arresting Citizenship,” which details how contact with the criminal justice system decreases faith in the capacity for political institutions to respond to Americans’ concerns and diminishes people’s sense of equal citizenship.
-
David Knight, Columbia University, assistant professor of sociology and a Faculty Fellow in the Institute for Research in African-American Studies. Knight is currently developing survey weights to make The Marshall Project’s survey representative of the demographics, types of facilities and geography of the United States jail and prison population. His research focuses on the consequences of mass incarceration and how Black communities mobilize in response to it.
-
Christopher Uggen, University of Minnesota, regents professor and distinguished McKnight professor in sociology, law, and public affairs: Uggen is the author of “Locked Out: Felon Disenfranchisement and American Democracy,” which quantifies both the overall scale and racial disparities of felony disenfranchisement. His current projects examine voting rights for people with criminal records, prison reentry and fairness in sentencing.
-
Ariel White, MIT, associate professor of political science: White is the author of a study that shows how even short stints in jail can decrease people’s civic participation. Her research focuses on voting and voting rights, race, the criminal justice system and bureaucratic behavior.
-
Blair Bowie, Campaign Legal Center: Bowie leads CLC’s Restore Your Vote initiative, which expands people’s access to rights restoration services. Through this project Bowie works with directly impacted communities to dismantle systemic barriers to the ballot box through advocacy, litigation and policy change.
Watch our webinar
On Oct. 29, 2024, The Marshall Project teamed up with The Journalist’s Resource to provide a webinar on “Covering Felony Disenfranchisement and the Politics of People Behind Bars.” We explored the complexities of voting with a felony conviction and discussed the results of TMP’s political survey of incarcerated people nationwide.
Our panelists included:
Nicole Lewis, engagement editor, The Marshall Project: Lewis has reported on felony disenfranchisement issues across the country and has conducted The Marshall Project’s political survey for the last four years.
David Eads, data editor, The Marshall Project: Eads conducted the data analysis for The Marshall Project’s political survey, and walked us through the data-sharing tools and important survey limitations.
Clark Merrefield, senior editor, The Journalist’s Resource: Merrefield covers economics and legal systems for TJR and previously reported for Newsweek and The Daily Beast. He discussed the complex maze of felony disenfranchisement laws across the country.
Don’t have time to watch the webinar? Check out this tip sheet provided by The Journalist’s Resource that recaps the video.
Important context on voting rights for people with felonies
There are many obstacles to voting
Obstacles to voting while in prison and after leaving prison are significant. Many prisons don’t do a good job of notifying people who are leaving their facilities about their rights. For instance, in New Jersey, we learned that people were given that information on a CD-ROM, making the information virtually inaccessible. Here are common obstacles that you may want to investigate in your state.
- Misinformation. We have found that the people working in the criminal justice system often don’t know the latest election laws in their state. This includes the prison administration and probation and parole officers. We’ve also found that some election officials don’t know their own rules. In some states, the actual voting forms may be incorrect, too. We found one such example in Colorado. And we have heard of the same in other states.
- ID Requirements. People who were in prison often don’t have a government-issued ID. And getting one after years behind bars can prove challenging. People may not have established residency, or they don’t have the required documents such as a utility bill or social security card. Sometimes people simply can’t afford to pay the fees.
- Additional Paperwork. Returning home after years behind bars comes with many challenges. People are often trying to find housing, a job and other markers of stability, so the paperwork and hassle of voting can get punted down on their to-do list. Find out if your state requires formerly incarcerated people to fill out additional paperwork in order to get back on the voter rolls, as we explored in Louisiana.
- Unclear Eligibility Rules. Some states have changed their laws many times and may have confusing criteria for eligibility, including Florida, Alabama, Mississippi and Tennessee. In some states, anyone who is no longer in prison is eligible to vote, while in other states, people with certain felony convictions cannot vote, nor can people on probation or parole. Here’s a deep dive into the discrepancies.
There’s been a re-enfranchisement backlash
Roughly 2 million people with felony convictions have regained the right to vote since the late ’90s, according to an analysis by The Sentencing Project, a research and advocacy organization working to reduce the number of people behind bars in the U.S. These restoration efforts — legislative changes, ballot initiatives and executive actions in 26 states and the District of Columbia — were largely bipartisan. Yet the GOP is working to roll back voting rights for people with felony convictions in several states. Here’s a look at some of the common disenfranchisement strategies.
- Fines and Fees. Florida voters restored voting rights for many people with felony convictions in 2018 via a ballot initiative. But GOP lawmakers intervened by requiring those folks to pay various fines and fees related to their conviction. Because people with felonies often can’t track down if those obligations have been met, it can be hard to know if they’re even eligible to vote.
- Fear of Rearrest. Without clarity on their eligibility, formerly incarcerated people may be afraid to vote because of the high-profile arrests of people who voted when they weren’t supposed to, including Crystal Mason and Pamela Moses. We found that the arrests of several Floridians in 2022 by Gov. Ron DeSantis’ election task force has scared off voters in neighboring states, too.
- “Election Integrity.” The conservative movement’s focus on “election integrity” puts formerly incarcerated voters at disproportionate risk. Voter fraud is exceedingly rare, studies show. Post-election audits are unlikely to turn up dead voters, but will likely surface voters with felony records who voted before they were legally eligible. For example, the majority of the people prosecuted for voter fraud in Wisconsin over the last decade voted while on probation, Wisconsin Watch found.
- A Note on Fraud. Illegal voting is not “probable cause for voter fraud,” said Blair Bowie who leads Campaign Legal Center’s efforts to restore voting rights to the formerly incarcerated. “There must be evidence regarding knowledge of ineligibility, as well.” Many people with felony convictions often receive no or incorrect information from the officials tasked with informing them of their rights. Corrections officials are often misinformed. And some state registration forms are inaccurate or unhelpful. As a result, the burden of ensuring eligibility falls on the voters — with criminal consequences for getting it wrong.
- Weaponized Bureaucracy. In Nebraska, the Republican attorney general issued an opinion that a 2024 law to restore voting rights to people immediately after leaving prison was unconstitutional. In Virginia, the Republican governor rescinded a policy of automatic voting rights restoration to people who finished their felony sentences. Election officials in Tennessee have blocked nearly all rights restoration by adding more requirements that disqualify people with felony convictions.
State policies on felony voting vary widely
According to the National Conference of State Legislatures:
- There are 23 states where people with felony convictions cannot vote while incarcerated but their voting rights are restored automatically upon release. With automatic restoration, people don’t have to petition or apply to vote — they can just vote like everyone else.
- People with felonies in 15 states lose their voting rights both during incarceration and for a length of time after being released when they are on parole or probation.
- In 10 states, voting rights can be taken away indefinitely or may require a pardon from the governor to be restored.
- Vermont, Maine and the District of Columbia are the only places where everyone in prison can vote, though procedural barriers can get in the way. In a handful of states, such as Mississippi, some people in prison are eligible because they were not charged with a disqualifying crime. In Texas, some people on death row are eligible to vote because of a little-known loophole.
To get summaries of several research articles on this topic, check out this helpful explainer from The Journalist’s Resource.
Style and standards
People-first language
You’ll notice throughout our Election Survey Toolkit that the words “inmates,” “prisoners,” “convicts” and “felons” don’t appear anywhere to describe the people who responded to our survey.
Instead, we use “people-first” language — such as “incarcerated people,” “people behind bars,” “people convicted of felonies” or “formerly incarcerated people.” These words avoid stigmatizing euphemisms and emphasize accuracy and clarity.
We make an exception for “prisoner” or “prisoners” in headlines, for brevity’s sake, and because it’s less fraught with stigma.
The difference between prisons and jails
“Prison” and “jail” should not be used interchangeably, as they are different types of facilities with distinct purposes.
Jails are typically local facilities run by counties or cities that detain people who are awaiting trial or sentencing, but may also hold people serving short sentences (usually less than a year) for minor crimes.
Prisons are run by the federal government or by states, and are designed to house people who have been convicted and sentenced of more serious crimes, often felonies, for longer periods of time.
In short, jails are for short-term detention and pre-trial holding, while prisons are for long-term incarceration after a conviction.
How to describe results from the data
References to this survey should state it includes responses from people in both prison and jail.
All figures presented in The Marshall Project’s reporting and in our public release should be expressed as the percent or number of respondents who answered the question or questions.
References to the survey should not over-generalize to the state’s whole incarcerated population. “In Ohio, 50% of respondents to the survey expressed a preference for Donald Trump after Kamala Harris entered the race” is OK, “Half of incarcerated people in Ohio prefer Donald Trump” is not.
Check out these resources for additional style and standards guidance to power your criminal justice reporting.
Credits
REPORTING
Nicole Lewis, Shannon Heffernan, Anna Flagg, Aala Abdullahi
PARTNERSHIP AND ENGAGEMENT ASSOCIATE FOR INVESTIGATE THIS!
Michelle Billman
EDITORIAL DIRECTION Ruth Baldwin
DATA EDITING
David Eads
ENGAGEMENT EDITING
Nicole Lewis
ILLUSTRATION
Diana Ejaita
ART DIRECTION
Celina Fang
STYLE & STANDARDS
Ghazala Irshad
PRODUCT
Elan Ullendorff
AUDIENCE ENGAGEMENT
Ashley Dye, Rachel Kincaid
COPY EDITING
Kelsey Adams, Lauren Hardie
OUTREACH
Terri Troncale, Rahima Nasa Kazmi